How much do we Work?
I recently followed Noah Pinion and twitter and started to read some of his work.
In Bidenomics, Explained, he pins part of his argument for a paradigm shift on a point I disagree with. In this note, I lay out why I diagree and what that means for his argument.
Table of Contents
Here's the claim: "if income tax cuts made people work more, it certainly isn’t apparent in the aggregate data: " accompanied by this image:
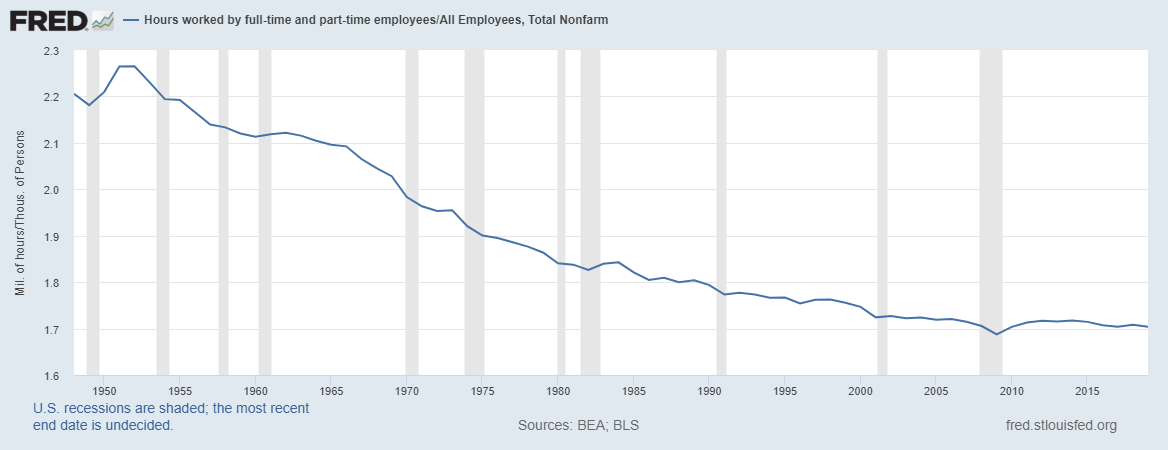 Data from FRED
Let's get into why I disagree.
Units and Part-Time Workers
The unit of the graph shown is Millions of hours/Thousands of Persons. There are two ways for this ratio to go down:
- Increase hours worked
- Increase the number of people working
I think number 2 is largely responsible for the decreasing trend seen in this graph.
In the same time period, many more people joined the work force. Specifically, many women working part time jobs joined the work force. That is exactly how you decrease the ratio Millions of hours/Thousands of Persons without decreasing number of hours worked.
That trend is seen here:
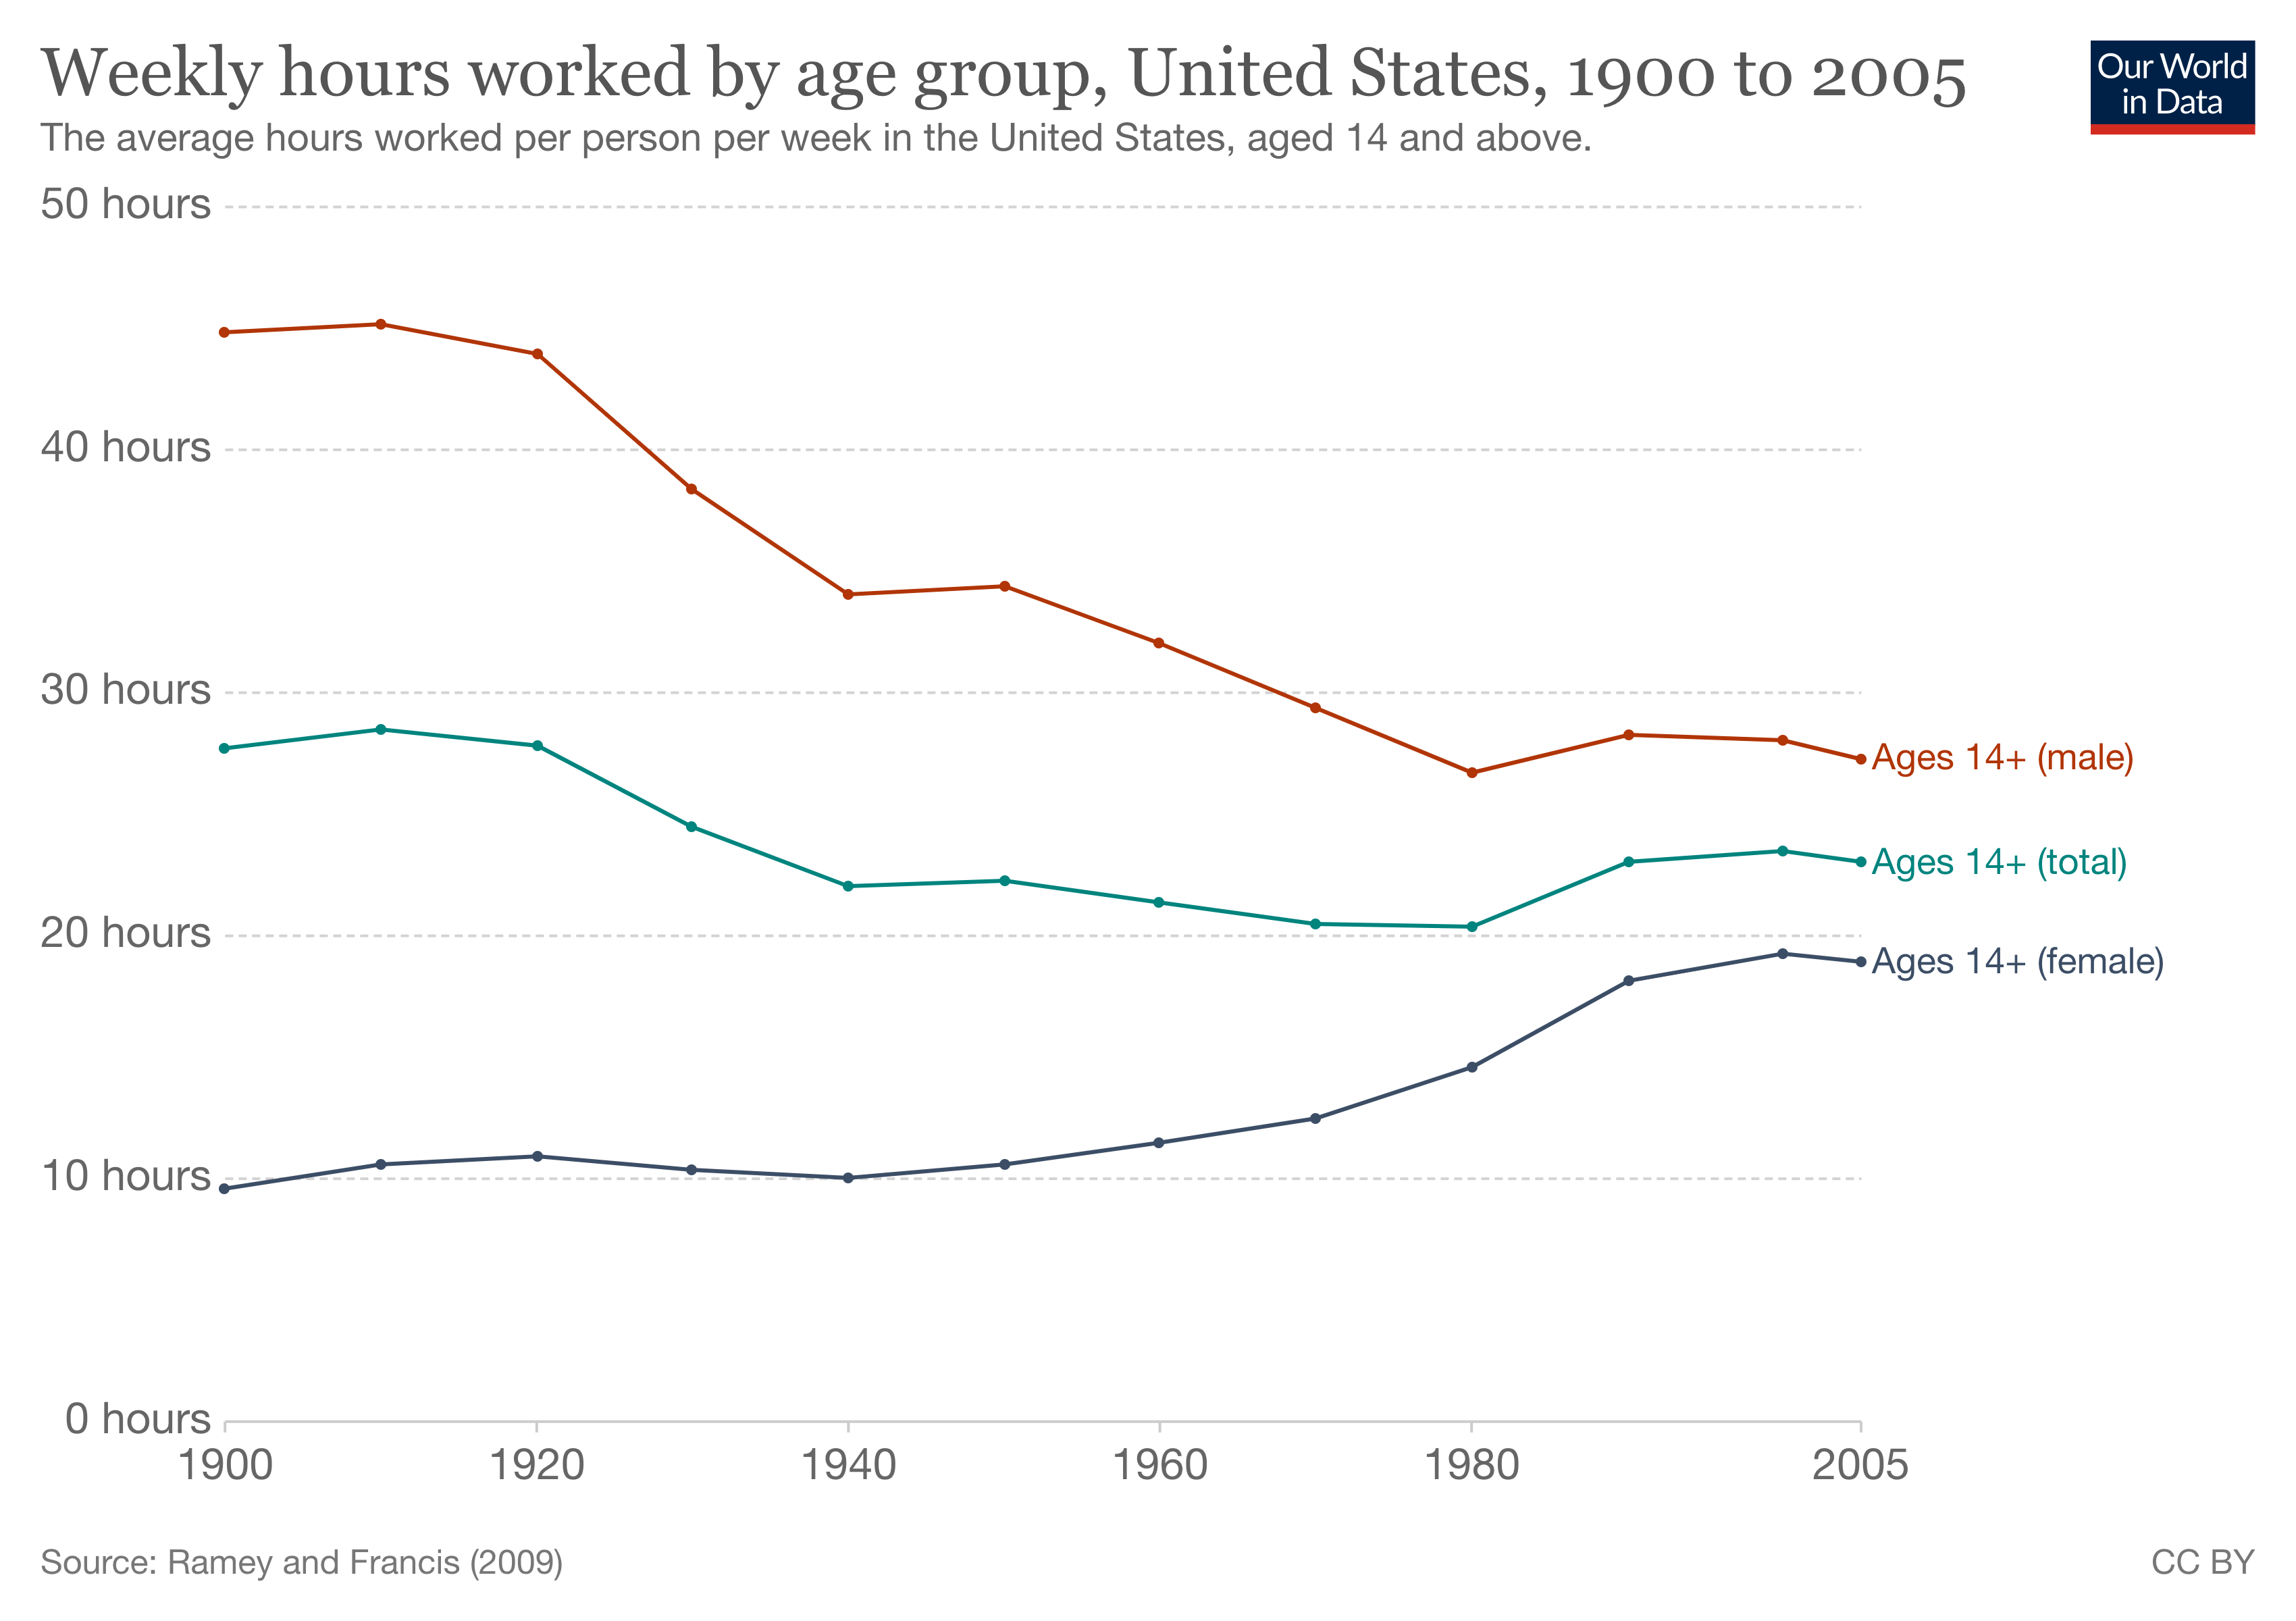 Data from Our World In Data
It is important to point out the slight decrease in total hours worked in this graph (say ~29 to ~25). I'd mostly attribute that to the 14-18 year olds included in this data, whom, on average, have worked less since the early 1900's.
Oshan's Argument
Next, I recently read some of [[Oshan Jarrow]]'s work (Treadmill Effect and UBI and the Capitalist Production of Consciousness). In those essays, he tells a much different story. According to him, average hours worked clearly declined from 1800-1930. Then, hours worked faced a period of stagnation until the 70/80's, when certain high status jobs started to work more hours.
For example, take a look at this graph of full-time, non-agricultural, production workers from 1870 to 2000:
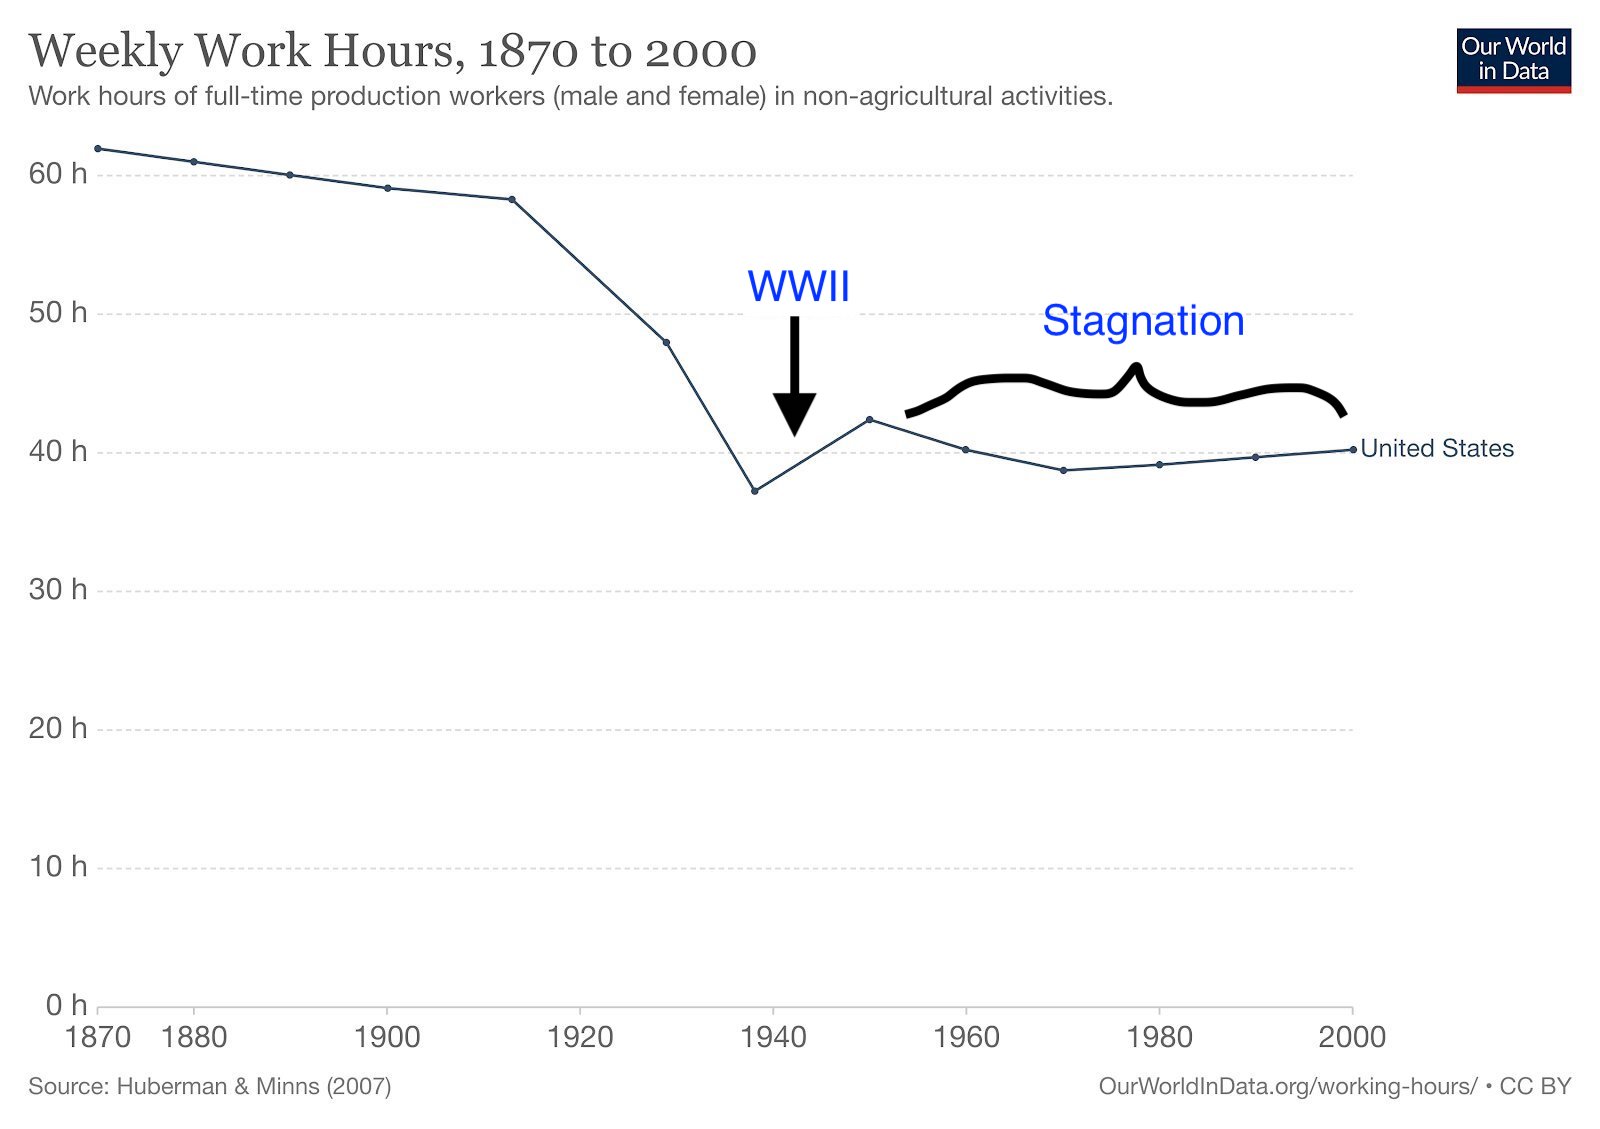 Data from our world in data, only US
We see the decline, (especially from 1910-1930), a small jump around World War II, then the stagnation that has held out until today.
Next, looking at data by occupation, we see that many fields have slowly started to work more since ~1970.
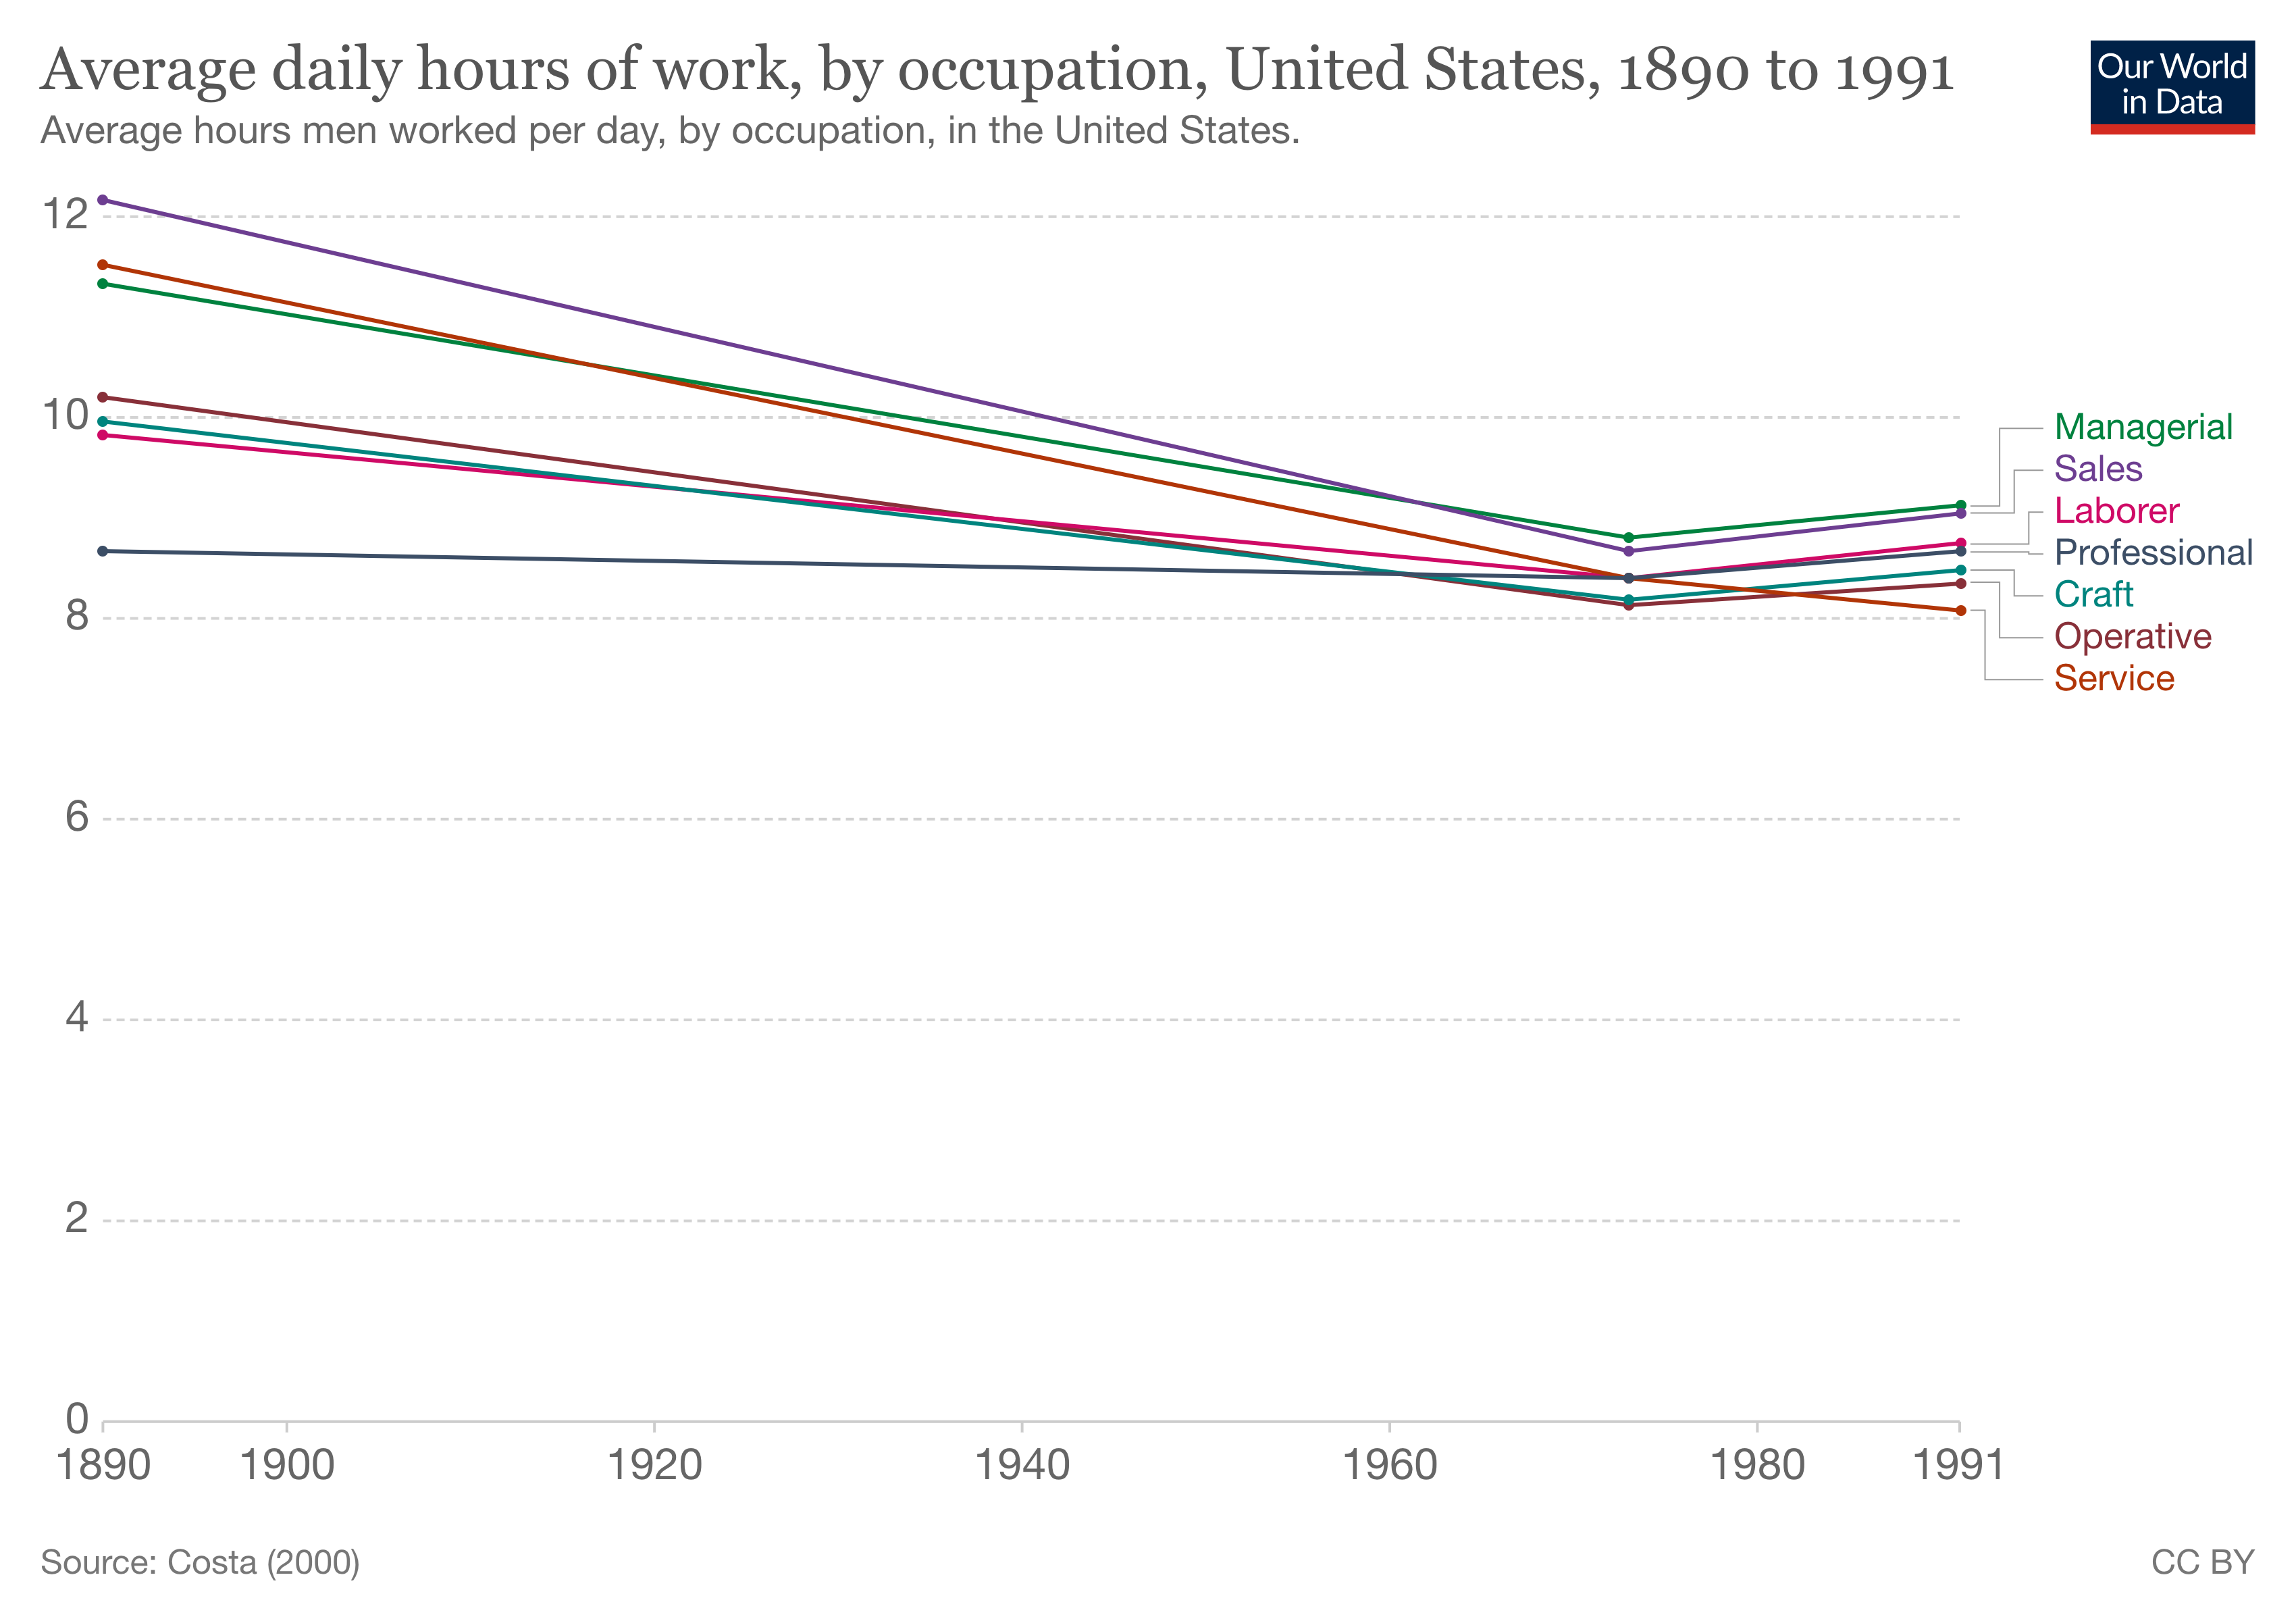 Data from our world in data
The only occupation that continued on a decreasing trend is Service.
This is when Oshan points out the perception of work had completely flipped. Almost suddenly, it became high status to work 100 hour weeks (think lawyers and investment bankers).
Lastly, total hours worked has continually increased.
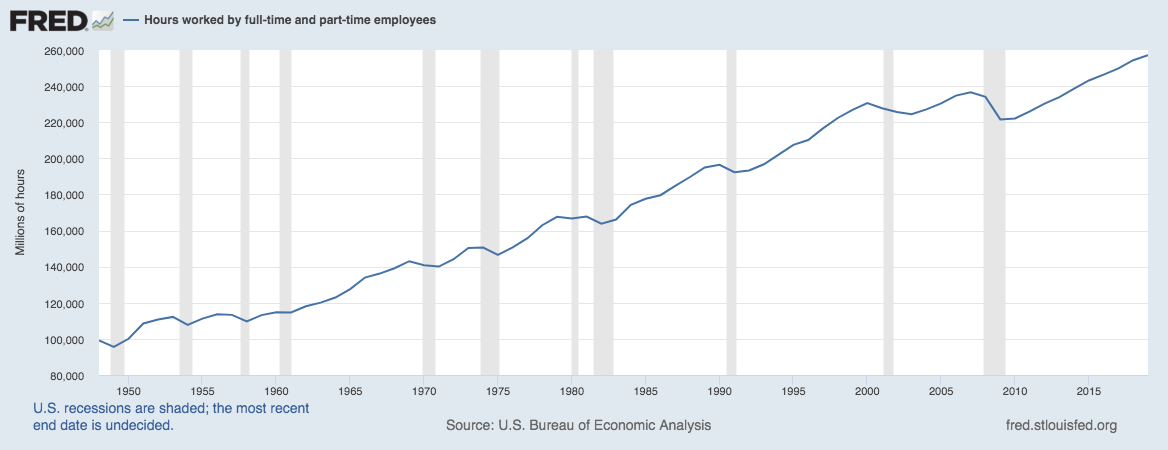 Data from FRED
This is more evidence pointing to the idea that the original decreasing trend decrease becuase more people were added to the work force, not because people are working less.
What Does this Mean?
In the end, I still agree with many of Noah's points. It is time for a paradigm shift. However, I disagree with the claim I pointed out at the beginning: "if income tax cuts made people work more, it certainly isn’t apparent in the aggregate data."
In fact, I think the better reason to pull back from these policies is precisely because they might be working.
I think it would be best to return to our pre-WWII perspective on work, which was that we wanted to do less of it. Let's put policies in place that keep that interest in mind.
My Linked Notes
- 2021-07-18
- 2021-07-18
- [[Noah Pinion]] made a claim in [[Bidenonmics Explained]] about hours worked by Americans that I disagree with. I wrote the note [[How Much Do We Work]] to explain why. Let me know what you think!
One last thing
If you liked these notes, hit me on Twitter!